Data Visualisation with R
US$35.00
15% OFF CODE: SAVE15
Description
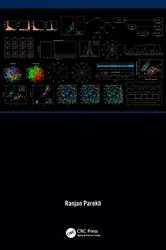
This book introduces readers to the fundamentals of creating presentation graphics using R, based on 100 detailed and complete scripts. It shows how bar and column charts, population pyramids, Lorenz curves, box plots, scatter plots, time series, radial polygons, Gantt charts, heat maps, bump charts, mosaic and balloon charts, and a series of different thematic map types can be created using R’s Base Graphics System. Every example uses real data and includes step-by-step explanations of the figu